excerpt
—
Supported by a grant from the Institute for Technology Assessment at the Karlsruhe Institute of Technology (KIT), I was commissioned as a communication designer by Madhumita Nandi, to explore new approaches to science communication and data visualisation. The project investigated how academic research, particularly within Science & Technology Studies (STS), can be translated into accessible, public-facing visual narratives.
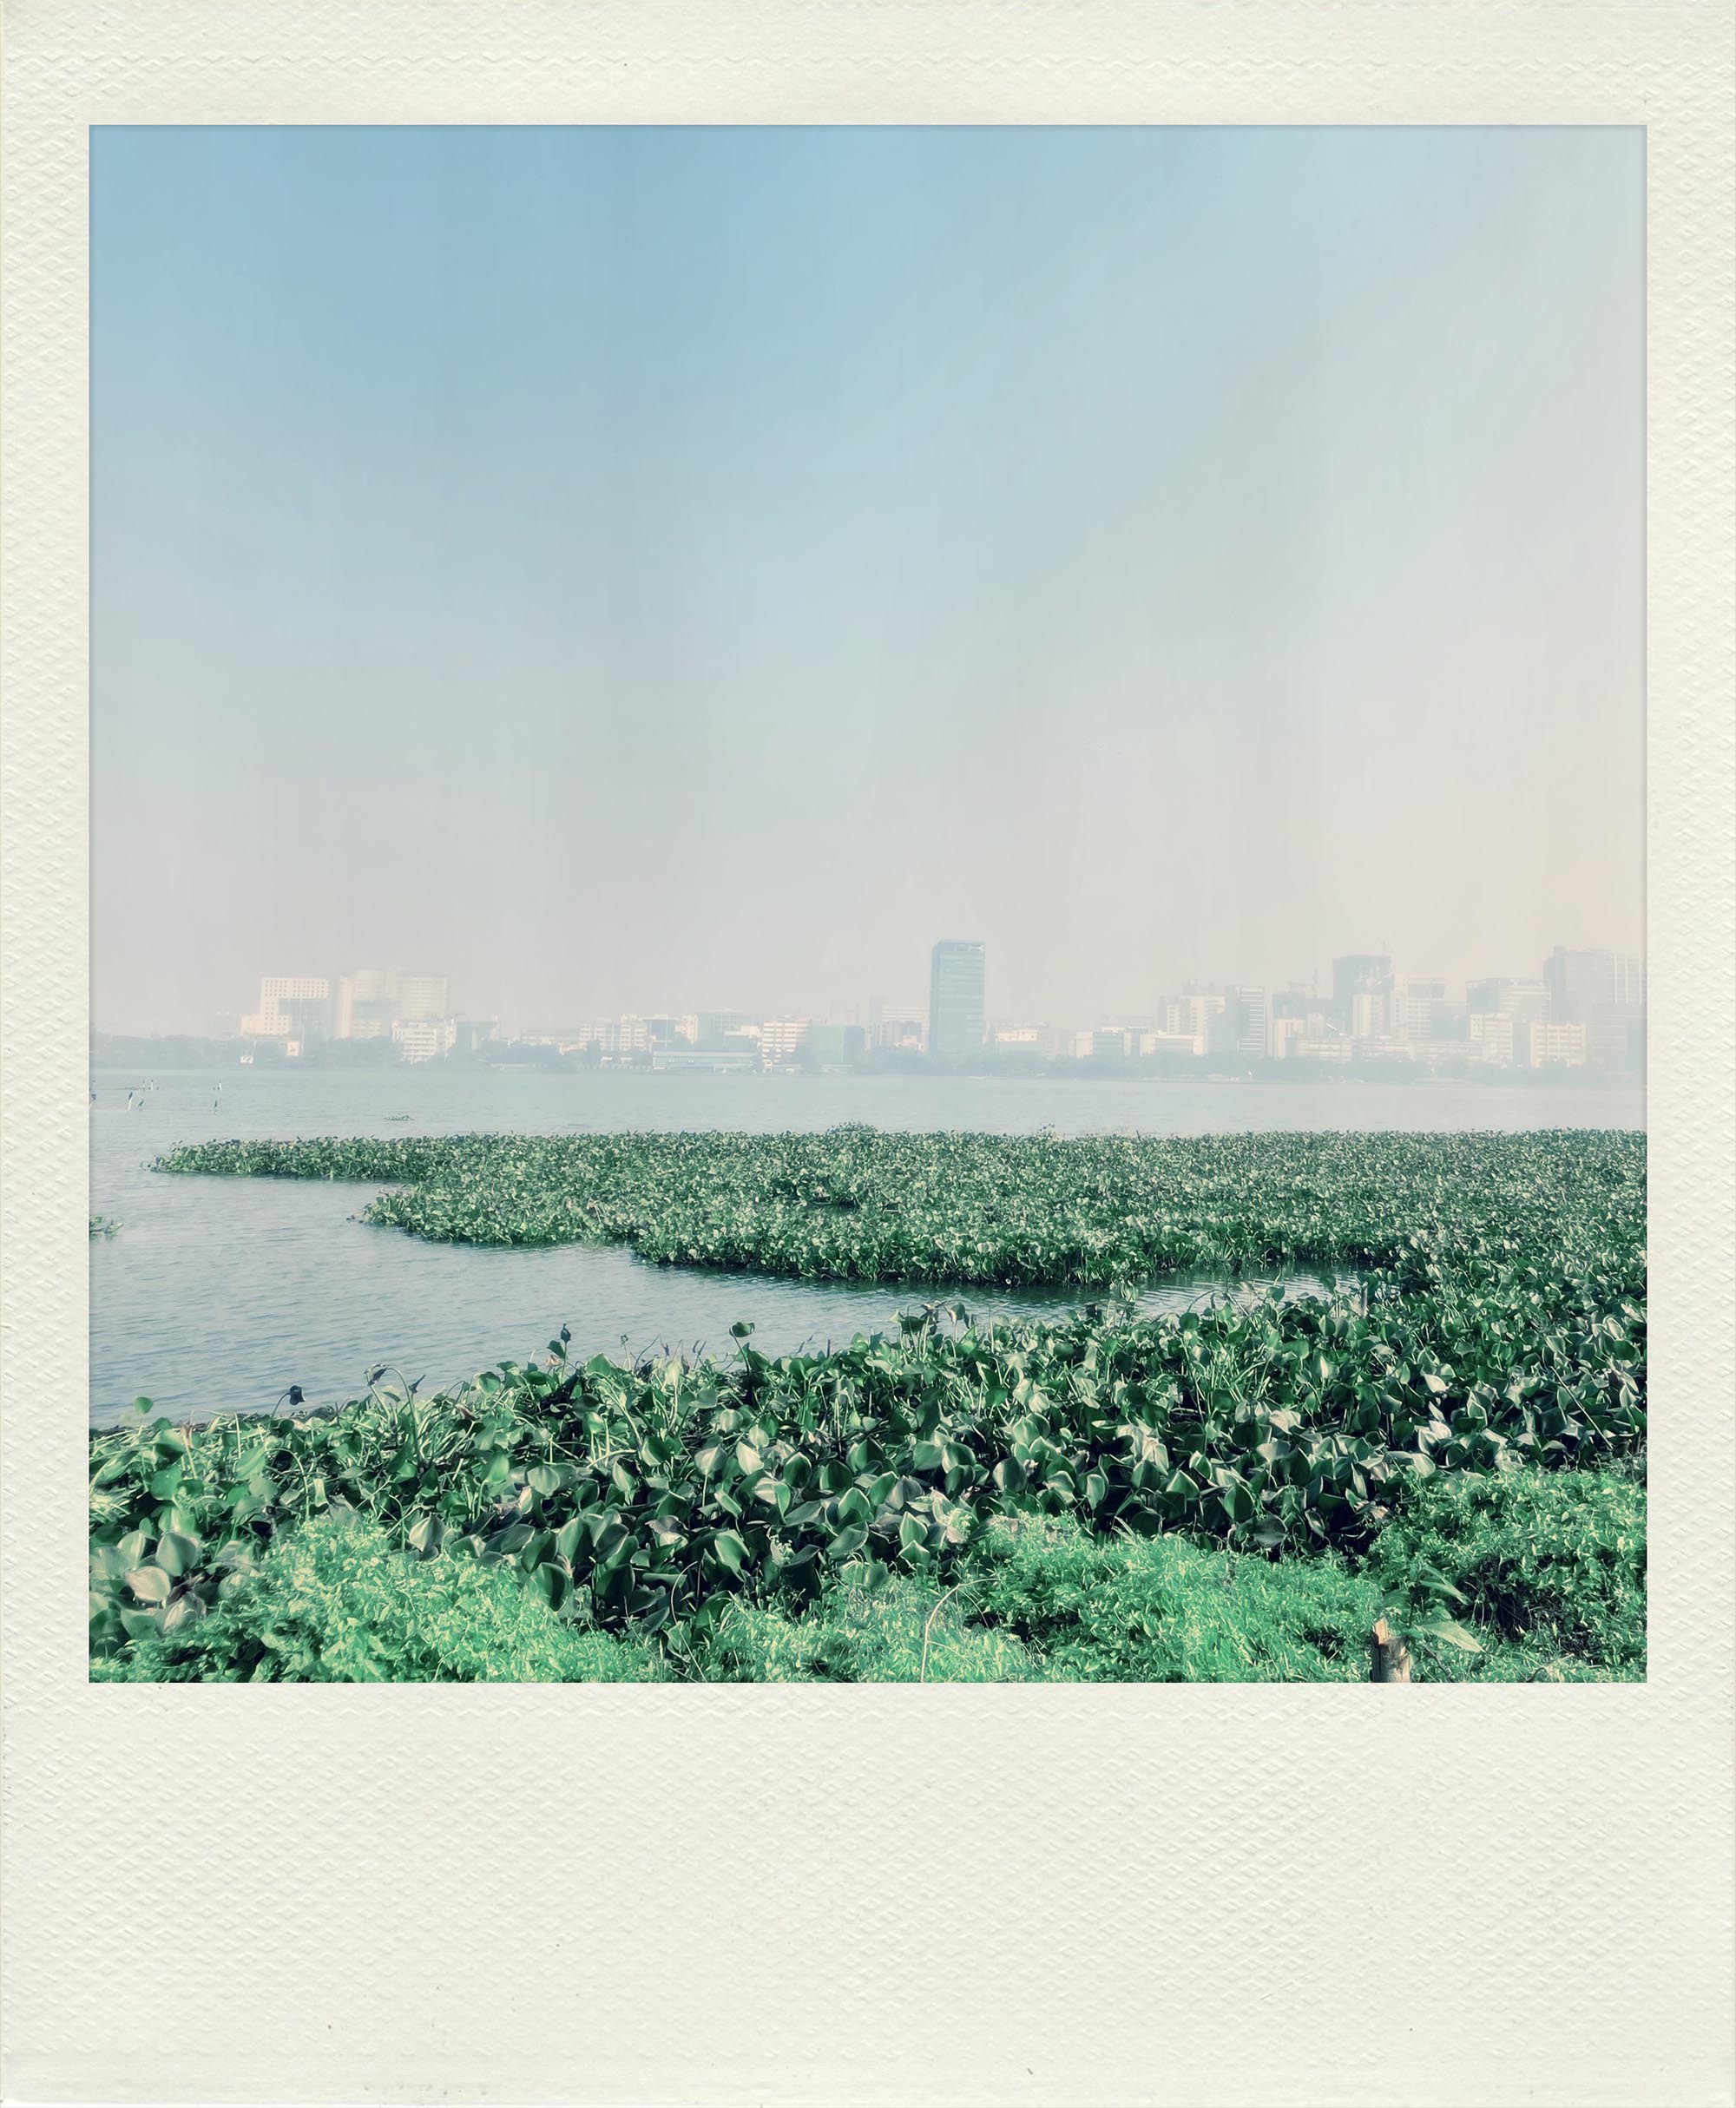
The research focused on the East Kolkata Wetlands, a Ramsar-designated urban wetland that sustains Kolkata through complex socio-ecological systems shaped by local practices, non-human actors, and women’s labour. Yet, it remains under threat from urbanisation, colonial planning legacies, and ongoing ecocide. Drawing on peer-reviewed scientific literature, ethnographic research, and publicly available geospatial data, I designed a visual prototype that communicates scientific knowledge through graphic storytelling.
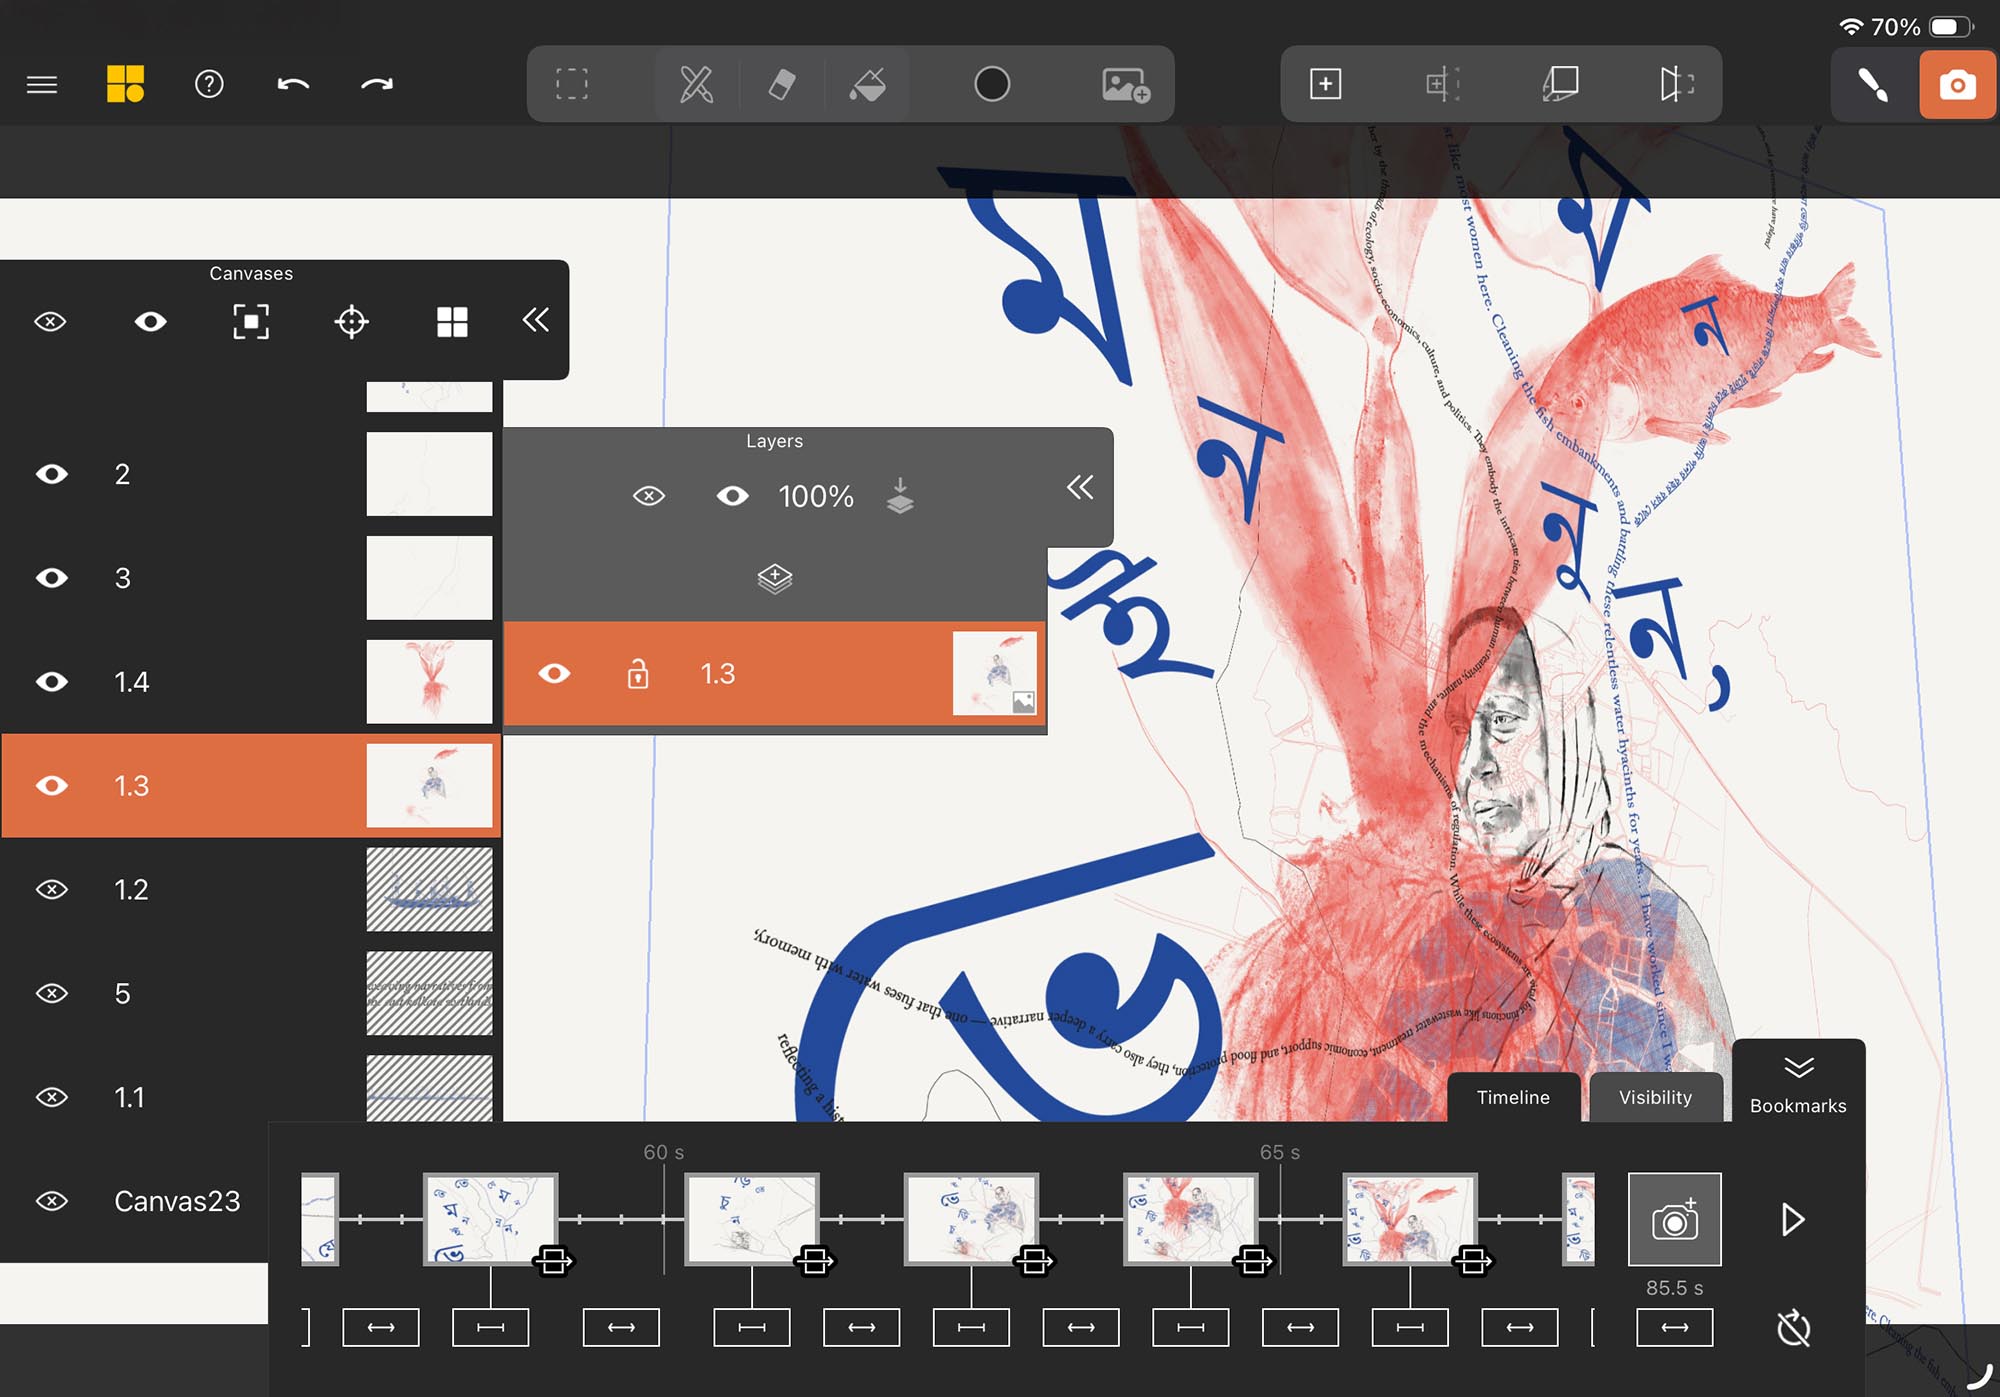
The prototype is an interactive, animated spatial drawing that combines typography and illustrations, layered onto illustrated maps derived from cartographic data organised in QGIS. Developed over three months, the project demonstrates how graphic journalism, critical ecology, and geospatial visualisation can intersect, and is currently seeking further funding to evolve into an interactive platform or an art-led activism project.
—
Supported by a grant from the Institute for Technology Assessment at the Karlsruhe Institute of Technology (KIT), I was commissioned as a communication designer by Madhumita Nandi, to explore new approaches to science communication and data visualisation. The project investigated how academic research, particularly within Science & Technology Studies (STS), can be translated into accessible, public-facing visual narratives.
The research focused on the East Kolkata Wetlands, a Ramsar-designated urban wetland that sustains Kolkata through complex socio-ecological systems shaped by local practices, non-human actors, and women’s labour. Yet, it remains under threat from urbanisation, colonial planning legacies, and ongoing ecocide. Drawing on peer-reviewed scientific literature, ethnographic research, and publicly available geospatial data, I designed a visual prototype that communicates scientific knowledge through graphic storytelling.
The prototype is an interactive, animated spatial drawing that combines typography and illustrations, layered onto illustrated maps derived from cartographic data organised in QGIS. Developed over three months, the project demonstrates how graphic journalism, critical ecology, and geospatial visualisation can intersect, and is currently seeking further funding to evolve into an interactive platform or an art-led activism project.
I.
animated flythrough
II.
process
︎ click on the contact sheet for a full-screen view of the images
![]()
![]()
![]()
![]()
![]()
![]()
![]()
![]()
![]()
![]()


III.
interactive illustration
︎ to navigate the interactive illustration, click on the canvas below
︎︎
Literature Search . Visual Research . Illustration . Lettering . Graphic Design . Open Source Mapping . Spatial Drawing . Animation
Literature Search . Visual Research . Illustration . Lettering . Graphic Design . Open Source Mapping . Spatial Drawing . Animation